📊 Deep Understanding of Chart Patterns (Beginner to Pro Level)
Stock market में price कभी भी random तरीके से move नहीं करता। हर move के पीछे buyers और sellers की psychology होती है।
जब यही behavior बार-बार repeat होता है, तो chart पर एक structure बनता है — जिसे Chart Pattern कहते हैं।
👉 Simple definition: Chart Pattern = Repeated Human Behavior in Market
अगर आपको trading सीखनी है तो पहले यह पढ़ना जरूरी है: 👉 How to Learn Trading for Beginners
---🧠 Market Psychology Behind Chart Patterns
हर pattern के पीछे एक story होती है। और वही story आपको profit दिलाती है।
📌 Buyers vs Sellers Battle
- Buyers → Price को ऊपर push करते हैं
- Sellers → Price को नीचे गिराते हैं
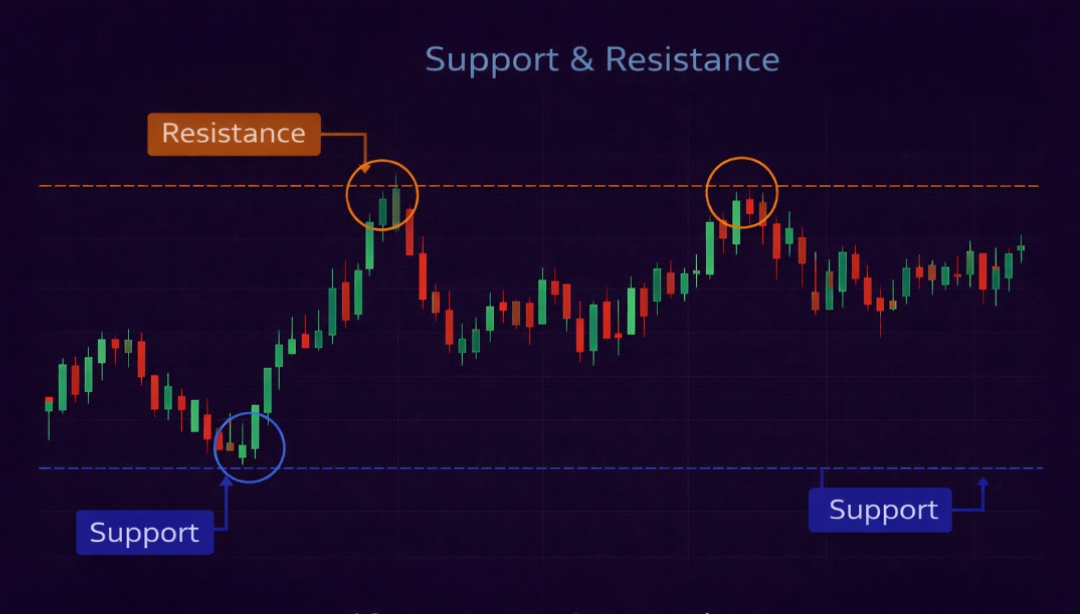
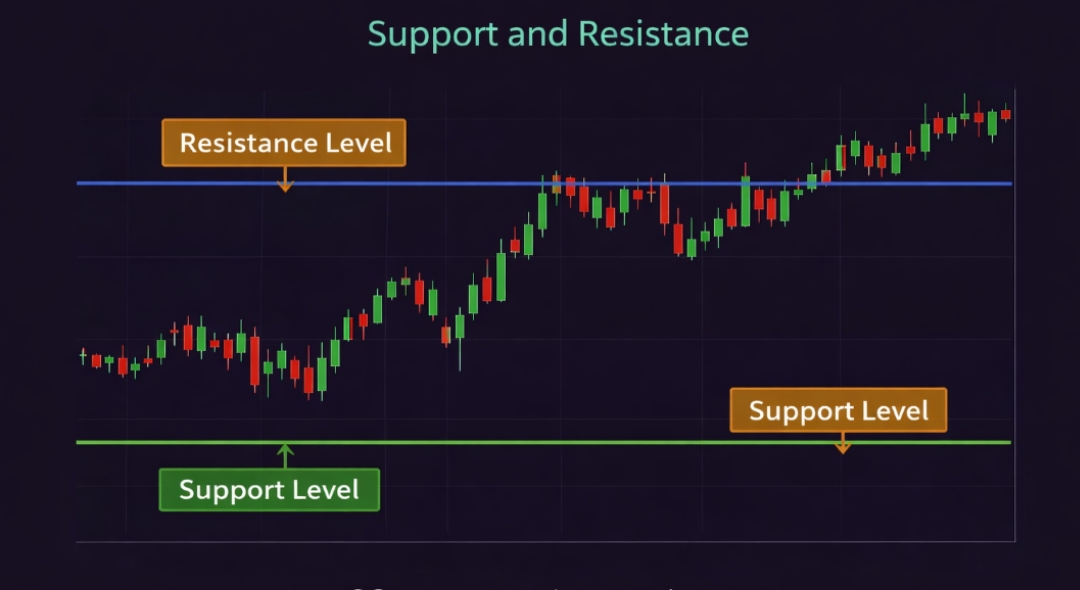
- जहाँ buying strong होती है → Support बनता है
- जहाँ selling strong होती है → Resistance बनता है
👉 Chart patterns इसी fight का visual structure हैं।
---📉 Why Chart Patterns Work?
- Market में Fear & Greed repeat होते हैं
- Institutions same strategies use करते हैं
- Retail traders same mistakes करते हैं
👉 इसलिए patterns बार-बार बनते हैं और काम करते हैं।
---📊 Core Foundation Before Learning Patterns
1. Trend Understanding
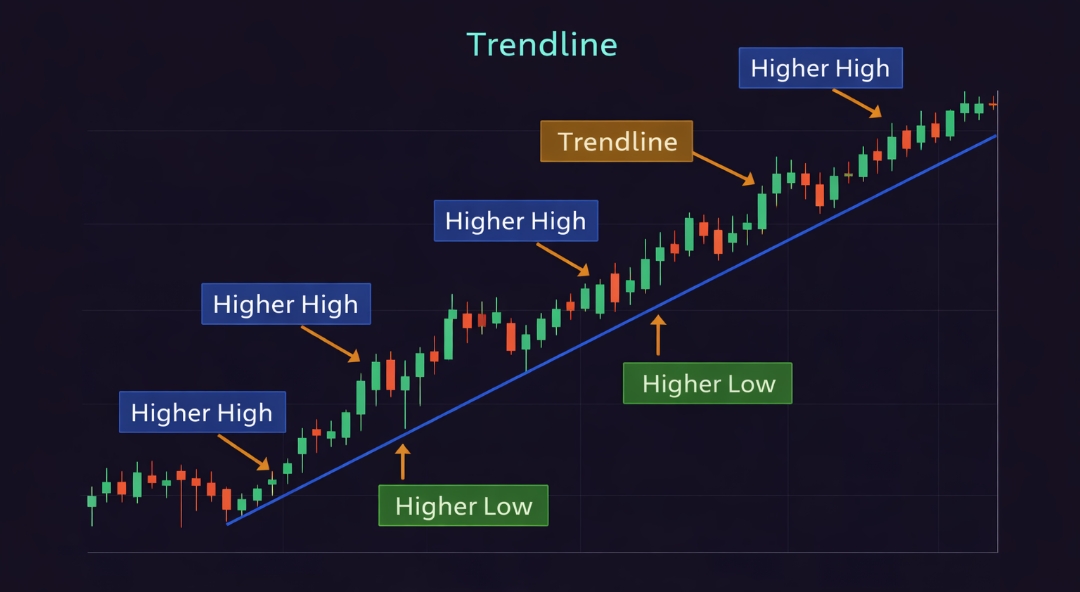
- Uptrend → Higher High + Higher Low
- Downtrend → Lower High + Lower Low
- Sideways → No clear direction
2. Support & Resistance
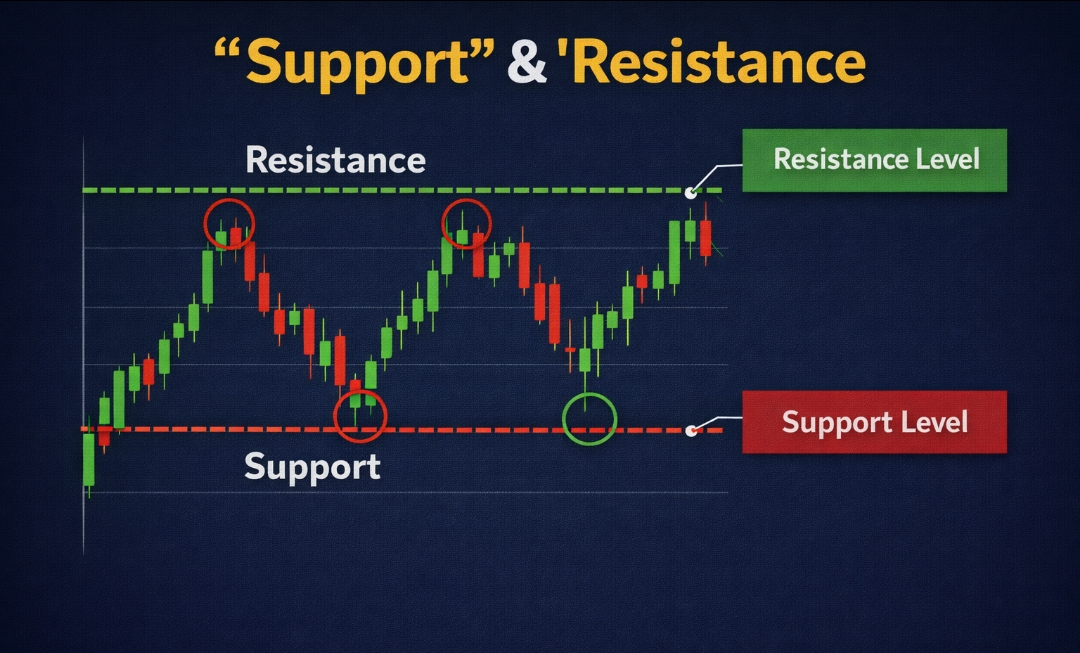
- Support → Price bounce करता है
- Resistance → Price reject होता है
3. Breakout & Breakdown
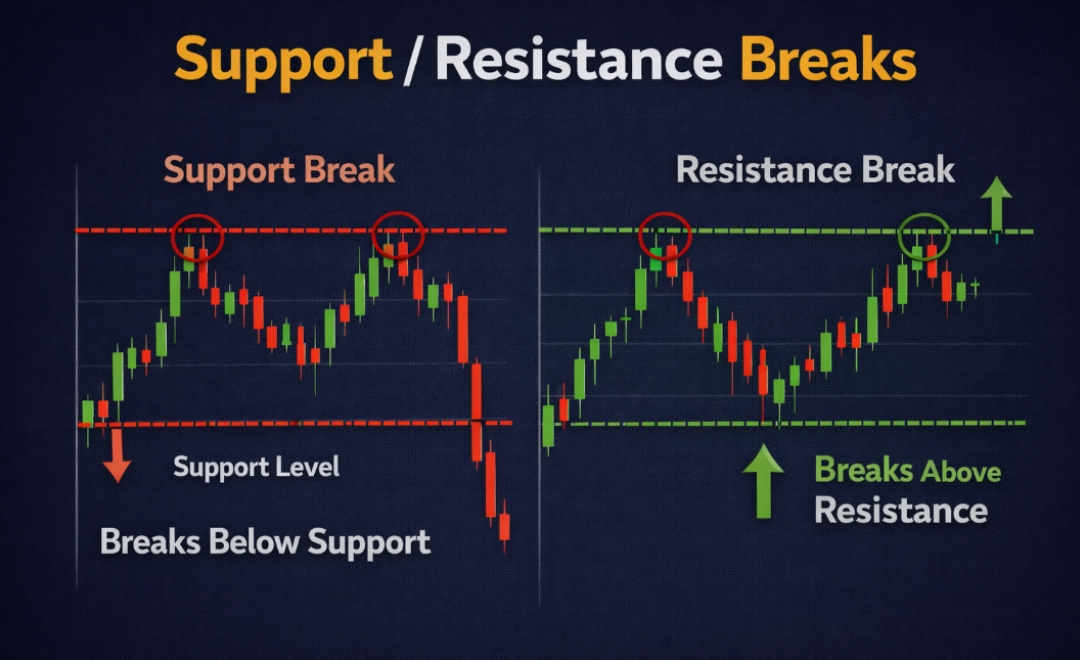
- Resistance break → Breakout
- Support break → Breakdown
4. Volume Importance
- High volume = strong move
- Low volume = weak move
👉 Risk manage करना सीखना equally important है: Risk Management Guide
---📈 Types of Chart Patterns (Detailed)
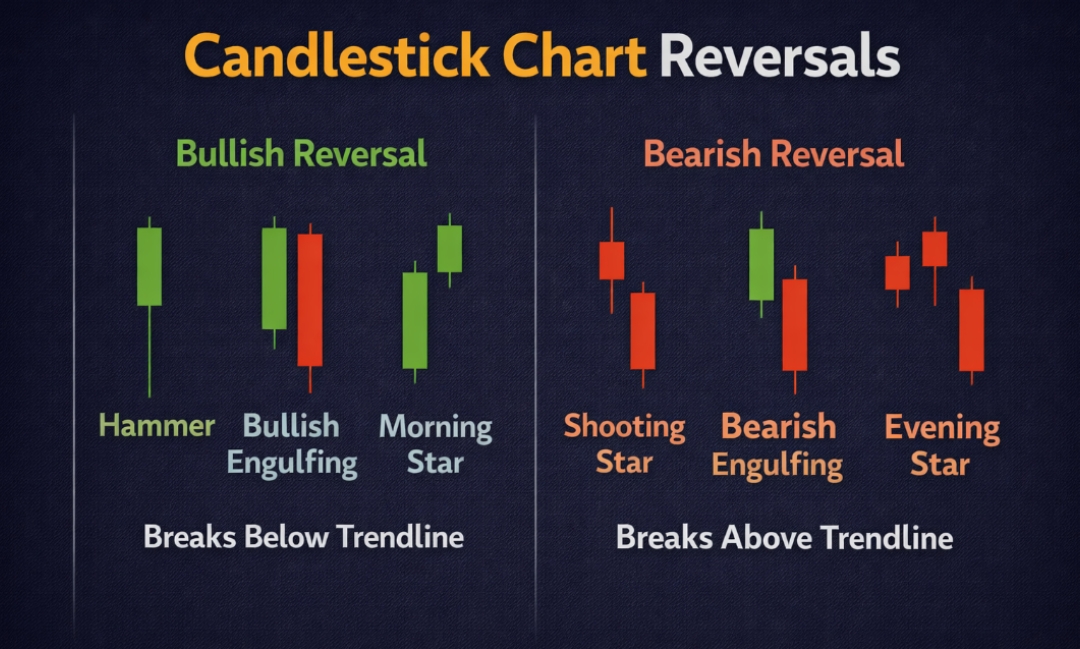
1. Reversal Patterns
Trend change होने का संकेत देते हैं।
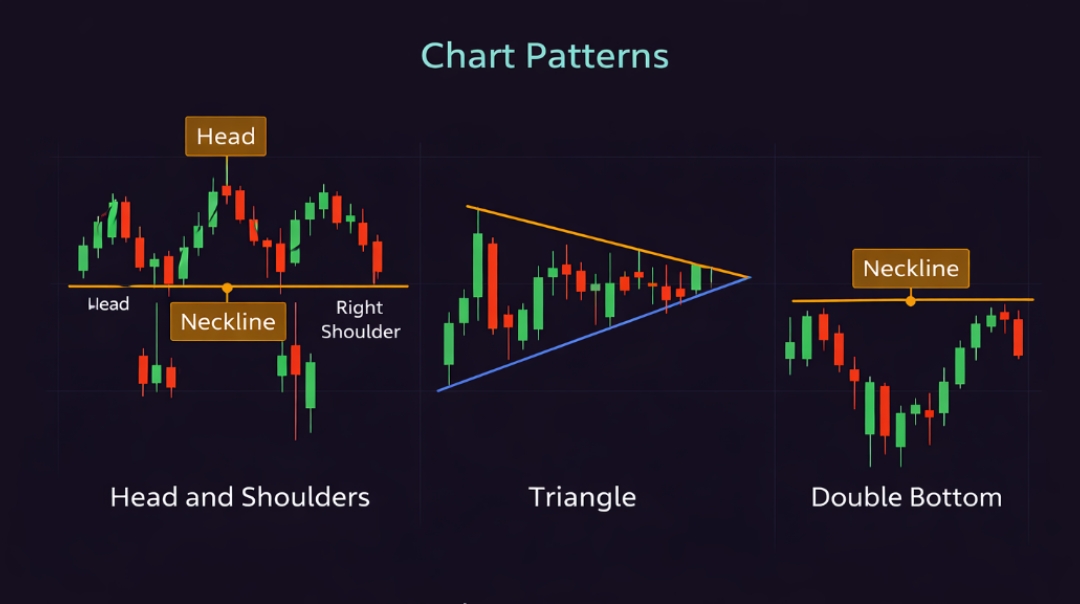
- Head & Shoulder
- Double Top
- Double Bottom
2. Continuation Patterns
Trend continue होने का signal देते हैं।
- Flag
- Pennant
- Triangle
🔥 Head and Shoulder Pattern (Ultimate Guide)
📌 What is Head & Shoulder Pattern?
यह एक bearish reversal pattern है जो uptrend के end में बनता है।
👉 इसका मतलब: अब market नीचे जाने के लिए तैयार है।
---📊 Structure of Pattern
- Left Shoulder → First peak
- Head → Highest peak
- Right Shoulder → Weak peak
- Neckline → Support level
🧠 Psychology Behind Pattern
- Left Shoulder → Buyers strong
- Head → Buyers peak
- Right Shoulder → Weak buying
- Breakdown → Sellers control
📉 Entry Strategy
- Neckline break का wait करो
- Confirmation candle close होने दो
- Volume spike होना चाहिए
🎯 Target Formula
Head से neckline तक distance measure करो और उसी distance को नीचे project करो
---🛑 Stop Loss
- Right shoulder के ऊपर
⚠️ Mistakes to Avoid
- Early entry लेना
- Fake breakout में फँसना
- Volume ignore करना
🔄 Inverse Head & Shoulder
यह bullish reversal pattern है।
- Downtrend के end में बनता है
- Breakout ऊपर की तरफ होता है
📊 Strategy
- Neckline breakout → Buy
- Stop loss → Right shoulder के नीचे
- Target → Same measurement rule
📊 Pro Tips (Very Important)
- Volume हमेशा confirm होना चाहिए
- Retest entry safest होती है
- Higher timeframe ज्यादा reliable होता है
🎯 Final Insight
Chart patterns 100% guarantee नहीं देते — यह probability based system है।
👉 इसलिए हमेशा:
- Risk management follow करो
- Stop loss mandatory रखो
- Overtrading avoid करो
अगर आप next level सीखना चाहते हो: 👉 Trading for Beginners Part 2
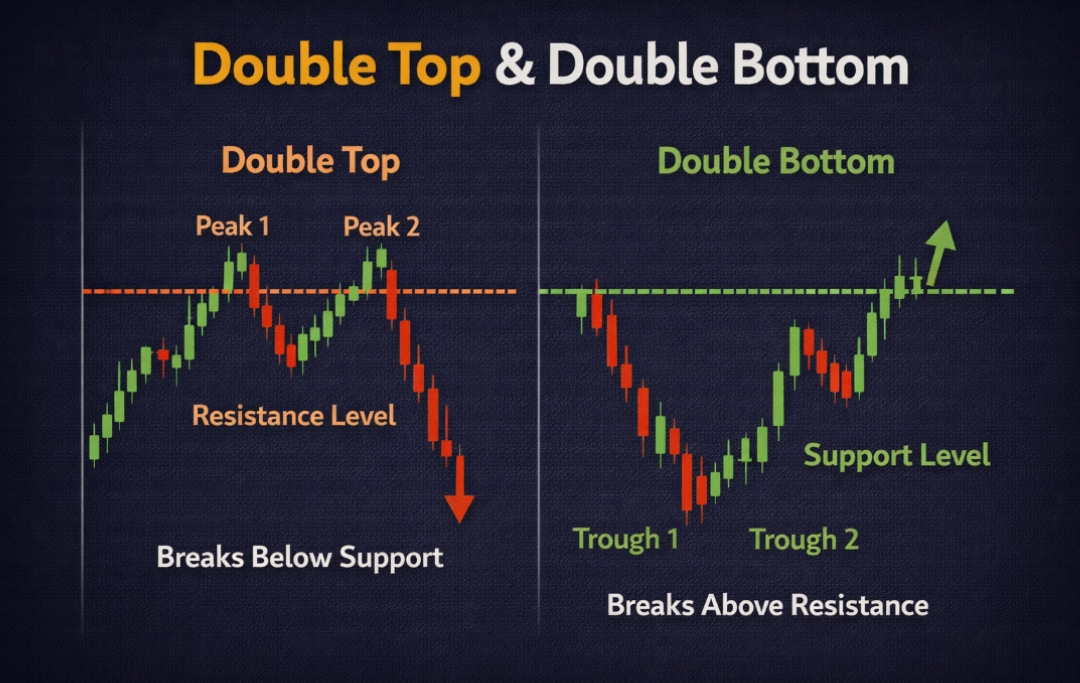
🔥 Double Top Pattern (Complete Pro Guide)
📌 What is Double Top?
Double Top एक bearish reversal pattern है जो uptrend के end में बनता है।
👉 इसका मतलब: Market अब नीचे जाने के लिए तैयार है।
---📊 Structure of Double Top
- First Top → Price resistance तक जाता है
- Pullback → Price नीचे आता है
- Second Top → Same level पर reject होता है
- Neckline → Support level
🧠 Psychology Behind Double Top
- First top → Buyers strong
- Second top → Buyers weak
- Resistance hold → Sellers active
- Breakdown → Panic selling
👉 यह pattern clearly दिखाता है कि buyers control lose कर रहे हैं।
---📉 Entry Strategy (Sell)
- Neckline break होने का wait करो
- Confirmation candle close होने दो
- Volume increase होना चाहिए
🎯 Target Calculation
Top से neckline तक distance measure करो और वही distance नीचे project करो
---🛑 Stop Loss
- Second top के ऊपर
⚠️ Common Mistakes
- Second top पर ही sell करना (गलत)
- Fake breakdown में entry लेना
- Volume ignore करना
🚀 Double Bottom Pattern (Bullish Setup)
📌 What is Double Bottom?
यह Double Top का opposite है और एक bullish reversal pattern है।
---📊 Structure
- First Bottom → Support touch
- Bounce → Price ऊपर जाता है
- Second Bottom → Same level hold
- Breakout → Resistance break
🧠 Psychology
- First bottom → Selling pressure
- Second bottom → Sellers weak
- Support hold → Buyers active
- Breakout → Strong buying
📈 Entry Strategy (Buy)
- Resistance breakout का wait करो
- Volume confirmation लो
- Retest entry best होती है
🎯 Target
Bottom से resistance तक distance → Same ऊपर project करो
---🛑 Stop Loss
- Second bottom के नीचे
📊 Double Top vs Double Bottom (Quick Comparison)
- Double Top → Bearish
- Double Bottom → Bullish
- Top → Sell setup
- Bottom → Buy setup
🧠 Advanced Concept: Fake Breakouts
Market में सबसे ज्यादा loss fake breakouts से होता है।
---📌 Fake Breakout क्या होता है?
जब price breakout करता है लेकिन तुरंत reverse हो जाता है।
---🚨 कैसे बचें?
- Always candle close का wait करो
- Volume check करो
- Retest entry लो
📊 Role of Volume in Patterns
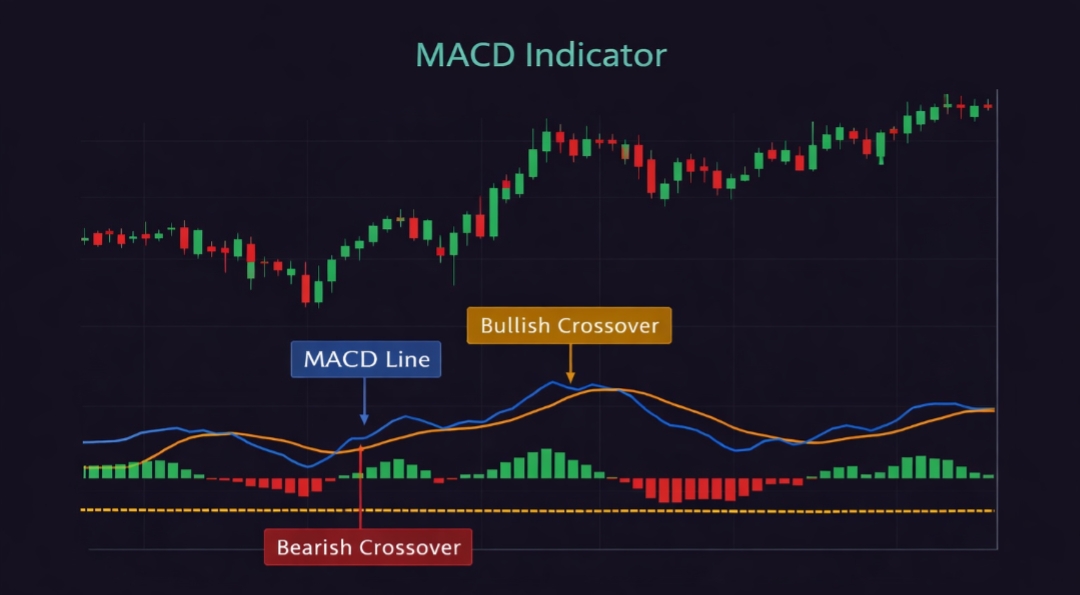
- Breakout बिना volume = weak signal
- High volume = strong confirmation
- Low volume = trap
💡 Smart Entry Strategy (Pro Level)
- Pattern identify करो
- Breakout wait करो
- Retest entry लो
- Stop loss set करो
⚠️ Important Rule (Golden Rule)
👉 Never trade pattern alone
- Support/Resistance combine करो
- Trend check करो
- Volume confirm करो
📊 Real Trading Flow
- Step 1 → Trend identify
- Step 2 → Pattern find
- Step 3 → Breakout wait
- Step 4 → Entry
- Step 5 → Risk manage
🎯 Final Insight
Double patterns simple दिखते हैं लेकिन सही तरीके से use करने पर बहुत powerful होते हैं।
👉 Discipline + Patience = Profit
🔺 Triangle Patterns (Complete Trading Mastery)
Triangle patterns सबसे ज्यादा common और reliable patterns होते हैं जो consolidation के बाद strong move देते हैं।
👉 Simple logic: Market energy build करता है → फिर explosion होता है
---📊 Types of Triangle Patterns
- Ascending Triangle
- Descending Triangle
- Symmetrical Triangle
📈 Ascending Triangle (Bullish Pattern)
📌 Structure
- Flat resistance (same level)
- Higher lows (buyers strong)
🧠 Psychology
- Sellers same level पर defend कर रहे हैं
- Buyers gradually strong हो रहे हैं
- Pressure build हो रहा है
- Breakout → Explosion move
📈 Entry Strategy
- Resistance breakout का wait करो
- Volume spike होना चाहिए
- Retest entry best होती है
🎯 Target
Triangle height measure करो और breakout direction में project करो
---🛑 Stop Loss
- Last higher low के नीचे
📉 Descending Triangle (Bearish Pattern)
📌 Structure
- Flat support
- Lower highs
🧠 Psychology
- Buyers support बचा रहे हैं
- Sellers लगातार दबाव डाल रहे हैं
- Support weak हो जाता है
- Breakdown → Sharp fall
📉 Entry Strategy
- Support breakdown का wait करो
- Volume confirm करो
- Retest entry लो
🎯 Target
Triangle height → Downside project
---🛑 Stop Loss
- Last lower high के ऊपर
🔄 Symmetrical Triangle (Neutral Pattern)
📌 Structure
- Lower highs
- Higher lows
🧠 Psychology
- Market indecision में है
- Buyers vs sellers बराबर fight
- Breakout direction unpredictable
📊 Strategy
- Breakout जिस direction में हो → उसी direction में trade करो
- Volume confirmation जरूरी
🔥 Breakout Mastery (Most Important)
Most traders यहीं गलती करते हैं।
---📌 Perfect Breakout Conditions
- Strong candle close
- High volume
- Clear structure
🚨 Fake Breakout Trap
Smart money अक्सर fake breakout create करता है ताकि retail traders trap हो जाएं।
---🧠 Smart Money Concept
- Retail breakout पर entry लेते हैं
- Smart money उल्टा move करता है
- Liquidity grab होता है
💡 Safe Entry Strategy
- Breakout के बाद retest का wait करो
- Immediate entry avoid करो
- Structure confirm करो
📊 High Probability Setup
- Triangle + Trend same direction
- Breakout + Volume spike
- Retest confirmation
⚠️ Common Mistakes
- Triangle incomplete होने पर entry
- Volume ignore करना
- Overtrading
🎯 Pro Trading Insight
Triangle जितना ज्यादा time लेता है breakout उतना powerful होता है।
👉 Patience = Profit
---🚀 Final Conclusion
Triangle patterns trading में सबसे ज्यादा use होने वाले patterns हैं।
अगर आपने इन्हें सही तरीके से master कर लिया तो breakout trading में आप pro बन सकते हो।
🚩 Flag Pattern (High Probability Continuation Setup)
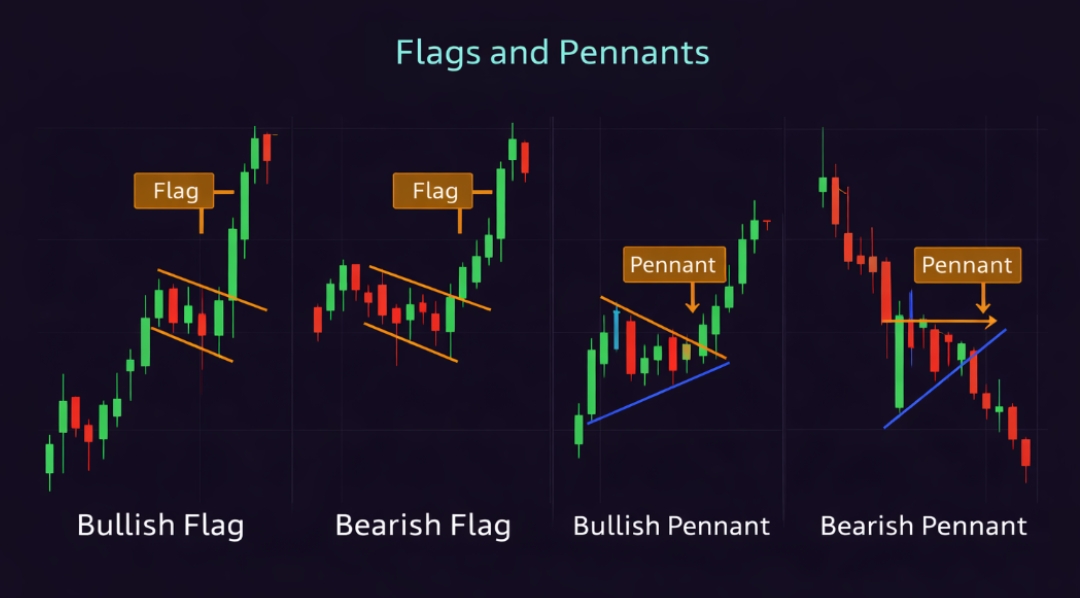
Flag pattern एक continuation pattern है जो strong trend के बाद बनता है।
👉 Simple logic: Strong move → Pause → Continue
---📊 Structure of Flag Pattern
- Strong impulse move (Flagpole)
- Small consolidation (Flag)
- Breakout → Same direction move
🧠 Psychology Behind Flag
- Strong buyers/sellers market control करते हैं
- Short pause आता है (profit booking)
- Trend continue होता है
📈 Bullish Flag
- Uptrend में बनता है
- Breakout ऊपर की तरफ
📉 Bearish Flag
- Downtrend में बनता है
- Breakdown नीचे की तरफ
📊 Entry Strategy
- Flag breakout का wait करो
- Volume spike होना चाहिए
- Retest entry best होती है
🎯 Target
Flagpole की length measure करो और breakout direction में project करो
---🛑 Stop Loss
- Flag structure के opposite side
🔺 Pennant Pattern (Fast Continuation Setup)
Pennant flag जैसा ही होता है लेकिन इसका shape triangle जैसा होता है।
---📊 Structure
- Strong move (pole)
- Small triangle consolidation
- Breakout → continuation
🧠 Psychology
- Market pause करता है
- Energy build होती है
- Explosion move आता है
📈 Strategy
- Breakout candle confirm करो
- Volume check करो
- Retest entry लो
🔥 Flag vs Pennant (Quick Comparison)
- Flag → Channel shape
- Pennant → Triangle shape
- दोनों continuation patterns हैं
🧠 Multi-Timeframe Analysis (Pro Level)
Professional traders हमेशा multiple timeframes use करते हैं।
---📊 कैसे use करें?
- Higher timeframe → Trend identify
- Lower timeframe → Entry find
📌 Example
- Daily chart → Uptrend
- 15 min chart → Flag pattern
- Breakout → Entry
📊 Sniper Entry Strategy
- Trend confirm (Higher timeframe)
- Pattern identify (Lower timeframe)
- Breakout + Retest
- Entry with stop loss
⚠️ Fake Continuation Trap
हर flag breakout successful नहीं होता।
---🚨 Trap पहचान कैसे करें?
- Low volume breakout
- Weak candles
- Opposite rejection
📊 High Probability Setup
- Strong trend + Flag
- Breakout + Volume
- Retest confirmation
💡 Pro Tips
- Short flags ज्यादा reliable होते हैं
- Long consolidation weak signal देता है
- Volume हमेशा confirm होना चाहिए
🎯 Final Insight
Flag और Pennant patterns trending market में सबसे powerful setups होते हैं।
👉 Trend is your best friend
---🚀 Summary (Quick Revision)
- Flag → Channel consolidation
- Pennant → Triangle consolidation
- Breakout → Same direction
- Volume → Confirmation
🚀 Complete Trading System (A to Z Framework)
अब तक आपने सारे patterns सीख लिए हैं। अब सबसे important चीज है — इन्हें system में use करना।
👉 Without system = Loss 👉 With system = Consistent profit
---📊 Step-by-Step Trading System
1️⃣ Trend Identify
- Higher timeframe (Daily / 4H)
- Trend direction find करो
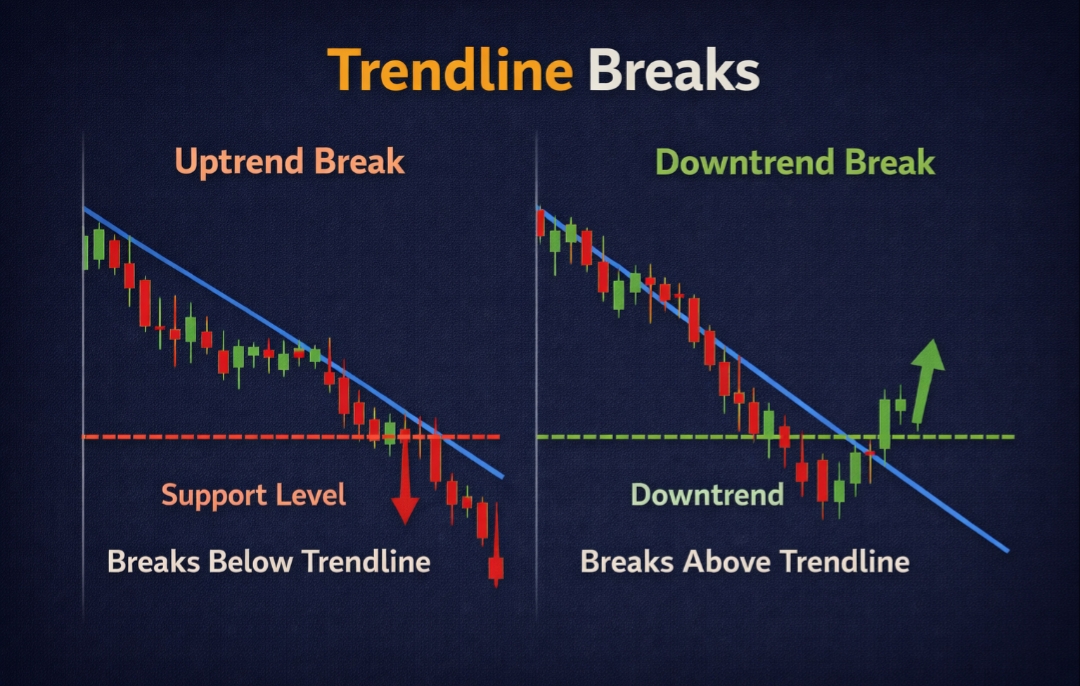
2️⃣ Key Levels Mark करो
- Support & Resistance
- Trendline
3️⃣ Pattern Identify
- Reversal या continuation pattern
4️⃣ Confirmation Wait करो
- Breakout / Breakdown
- Volume spike
5️⃣ Entry Plan करो
- Breakout entry या retest entry
6️⃣ Stop Loss Fix करो
- Structure के हिसाब से
7️⃣ Target Decide करो
- Pattern measurement
8️⃣ Risk Manage करो
- 1–2% rule follow करो
👉 Detailed पढ़ो: Risk Management Guide
---💡 Entry Types (Pro Level)
- Aggressive Entry → Breakout candle
- Safe Entry → Retest
- Sniper Entry → Liquidity grab के बाद
📉 Exit Strategy
- Partial profit booking
- Trailing stop loss
- Fixed target exit
⚠️ Risk Management Rules (Golden Rules)
- Never risk more than 2% per trade
- Always use stop loss
- Overtrading avoid करो
🧠 Trader Psychology (Most Important)
Trading में success 80% psychology पर depend करता है।
- Fear control करो
- Greed avoid करो
- Discipline maintain करो
📊 Complete Trading Workflow
- Trend → Pattern → Breakout → Entry → SL → Target
📚 Internal Learning Links
---❓ FAQ (SEO Booster Section)
Q1: Chart patterns कितने reliable होते हैं?
Proper confirmation और volume के साथ 60–70% accuracy दे सकते हैं।
Q2: Best pattern कौन सा है?
कोई single best pattern नहीं होता — combination best होता है।
Q3: क्या beginners use कर सकते हैं?
हाँ, लेकिन पहले basics clear होने चाहिए।
Q4: क्या बिना stop loss trading कर सकते हैं?
नहीं — यह सबसे बड़ी mistake है।
---🎯 Final Conclusion
Chart patterns trading का backbone हैं।
अगर आप इन्हें सही तरीके से use करते हैं तो आप consistent trader बन सकते हैं।
👉 Success formula:
- Knowledge + Practice + Discipline